
Linear regression is a statistical method used to analyze the relationship between two variables. It can help you predict how one variable will change in response to changes in another variable. There are three types of linear regression: simple, multiple, and polynomial. The type of linear regression that is best for your needs depends on what you want to learn from it. This blog post will discuss the three types of linear regressions and guide you through using each one with examples!
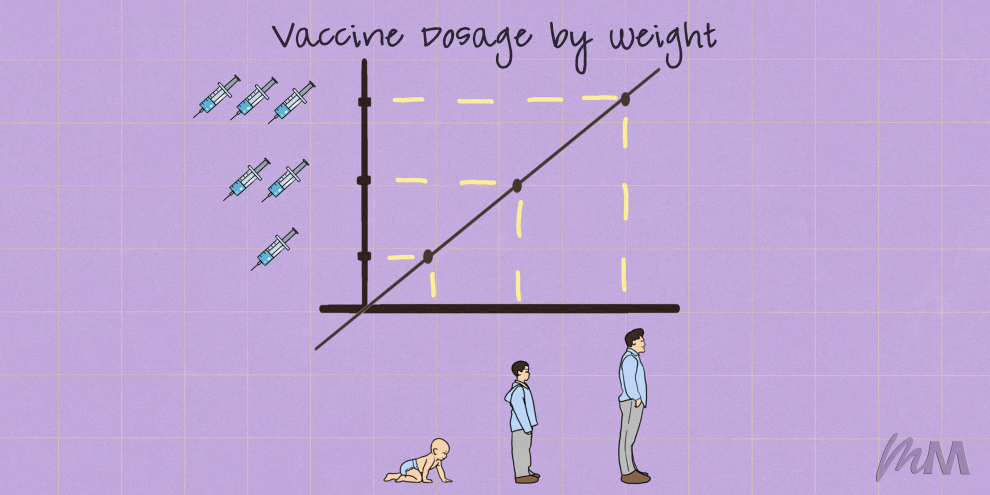
Linear regression is generally used to predict a single dependent variable given one or more independent variables. The graph above shows an example of how linear regression works to predict the value y for different values of x .
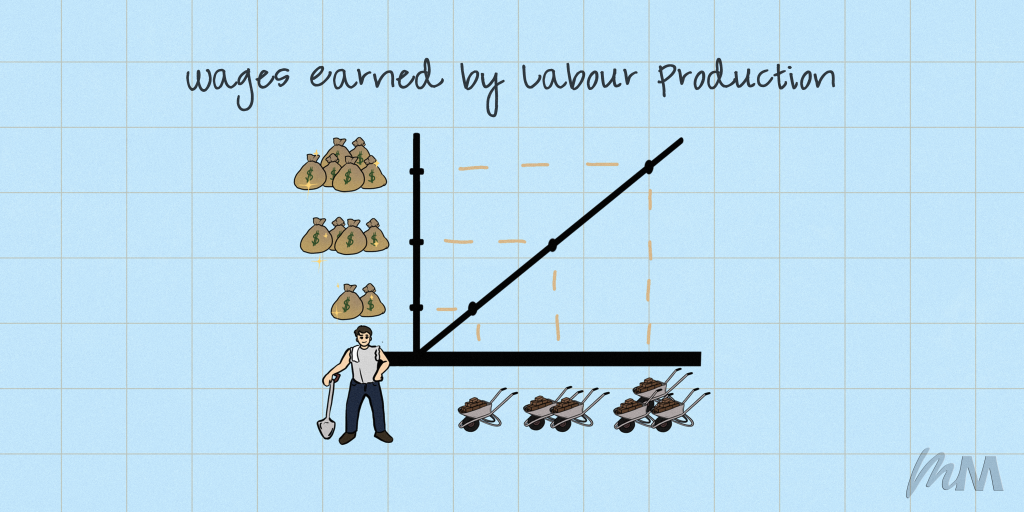
As you can see, with each increase in x (in this case labour production), there is also an expected corresponding increase/decrease (in this case increase) in the value of y (money earned) that is predicted. In other words, as you work harder by producing one more wheelbarrow of effort, the money you earn increases by one unit, y also generally increases/decreases in a corresponding manner.
This is a simple but extremely powerful concept. Practically speaking, linear regression can help you determine factors that are important in determining a particular dependent variable. For example, if you were interested in why some countries have higher GDPs than others, linear regression could help you determine the connection between two variables: number of years since becoming an independent country and their corresponding GDP per capita .
So why are there more than one type of linear regression? The different types of linear regression reflect the nature in which you want to understand your data.
Simple Linear Regression Explained
The first type is simple linear regression, and it assumes that there exists a relationship between two variables such that knowing one variable completely determines the other . In this case, y can be thought of as a function of x . The following equation models this:
Y = β 0 +β x X
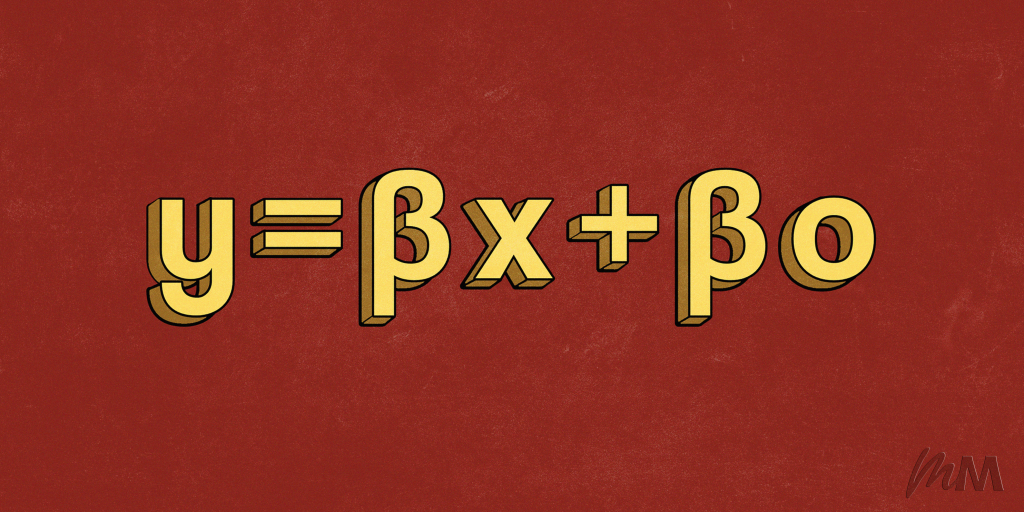
The Greek letter “beta” (β) or sometimes referred to as “m” represents the slope of a data point. In other words, for each unit increase in one variable, there will be an expected corresponding change in another . The value of Y can be thought of as either a constant or function depending on whether you want to predict or explain the value of Y (the dependent variable). The parameter β 0 is simply a constant and does not change.
Multiple Linear Regression Explained
The second type of linear regression is multiple linear regression, which allows you to determine how two or more independent variables are related with your dependent variable . In this case, y can be thought of as a function of x and z . The following equation models this:
Y = β 0 +β x X+ β ZZ W
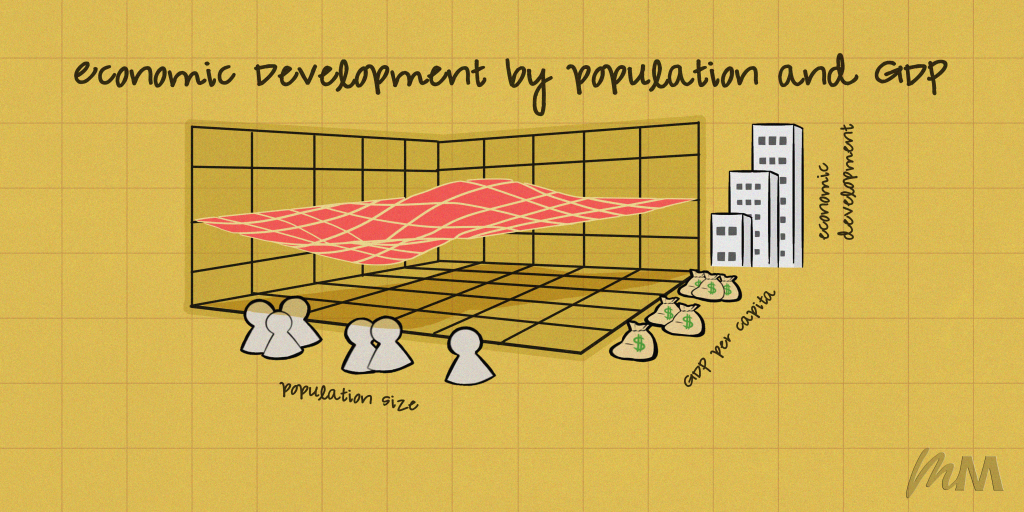
The situations in which you would consider using multiple regression are usually those where you want to consider the effect of multiple independent variables that may have different effects on your dependent variable. For example, if you were interested in how population size and GDP per capita (two separate independent variables) affect a country’s level of economic development , it would make sense to use this type of linear regression model because they both contribute to a country’s development in different ways.
Polynomial Linear Regression Explained
The third type of linear regression is polynomial regression, which allows you to determine how your dependent variable changes with respect to two or more independent variables as they increase/decrease exponentially . In this case, y can be thought of as an exponential function of x and z , where e represents the base of natural logarithms:
Y = β 0 +β x X+ β ZZ W e)

The scenarios in which you would consider using polynomial regression are usually those where your data displays a pattern that is best described by an exponential function. For example, if you were interested in how the value of electricity demand changes as consumption increases exponentially over time , it would make sense to use this type of linear regression model because your data displays an exponential pattern that is best described by using a polynomial function.
Logistics Regression Explained
The fourth and final kind of linear regression is logistic regression, which allows you to determine how the dependent variable changes with respect to two or more independent variables as they increase/decrease based on differential changes in probability . In this case, y can be thought of as a probability function of x and z , where p represents the change in an independent variable that results from changing the dependent variable by one unit:
P(Y = k|X=x) = β 0 +β x X+ β ZZ W p)
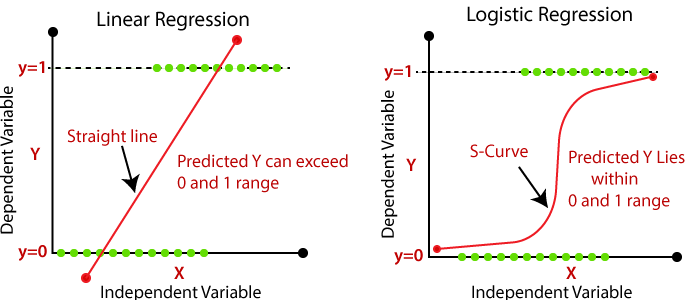
The settings in which you would consider using logistic regression are usually those where your dependent variable is categorical, meaning it can only take on one of a finite number of values. For example, if you were interested in how the probability that an individual voted for Obama changes as income increases , based on a regression model, it would make sense to use this type of linear regression because your data displays a pattern that is best described by using logistic function.
While linear regression is the most common type of statistical analysis performed in practice, it can be limiting because many relationships are not proportional. There are other types of regressions that account for non-linear patterns and outliers . For example, polynomial regression allows you to determine how your dependent variable changes with respect to two or more independent variables as they increase/decrease exponentially. Similarly, logistic regression allows you to determine how the dependent variable changes with respect to two or more independent variables as they increase/decrease based on differential changes in probability .
Summary of Main Linear Regression Models
In summary, though it has limitations, linear regression is a statistical method that can help you explain and predict the relationship between your dependent and one or more independent variables. It’s a simple but powerful model that you can use to generalize relationships we see in the real world.


Add Comment